Implementing DORA key software delivery metrics
Deep dive on how to implement the four key software delivery metrics.
To ensure that your software process improvement process is having the desired results, you need to measure the before and after of any change.
Following the research in DORA, summarized in the Accelerate book, the key metrics to use are:
- For performance: delivery lead time and deployment frequency.
- For stability: time to restore service and change fail rate.
If you are not familiar with them, you can find their definition here.
This post is a deep dive on how we implemented them at Akvo both for regular applications and blue/green ones.
Regular applications
Let’s start explaining what is our development process:
- Any commit to trunk/main is deployed to the Test environment.
- Sometimes, after some manual QA, the Test environment is promoted to Production.
- Promotion == take whatever is running right now in Test and deploy it to Production.
- The promotion script looks at the git SHA in Test and tags it with
promote-$datetimewhich will trigger a CI build that will do the production deploy.
- On promotion, no new binaries/containers are created, hence no build or test is required, only the deployment is needed.
1. Deployment frequency
For regular applications, calculating the deployment frequency is almost straightforward: look at the git tags with the pattern promote-$datetime, or look at the CI builds for such tags.
The caveat is that the CI deploy may fail, and if it fails, it may fail before or after the deployment step, so it starts to get tricky to decide if the deployment happened or not.
Ideally you want to look at the system itself to find out what has been deployed, something like Google App Engine’s gcloud app versions list or Kubernetes’ kubectl rollout history.
At Akvo, we chose the simple git tag count, as the most likely case for the CI build to fail was that the application failed to start, which we will still want to count as a deployment.
Here is the code to get all the tags using GitHub’s GraphQL api, here for getting all the TravisCI builds and here all the Semaphore’s ones.
2. Delivery lead time
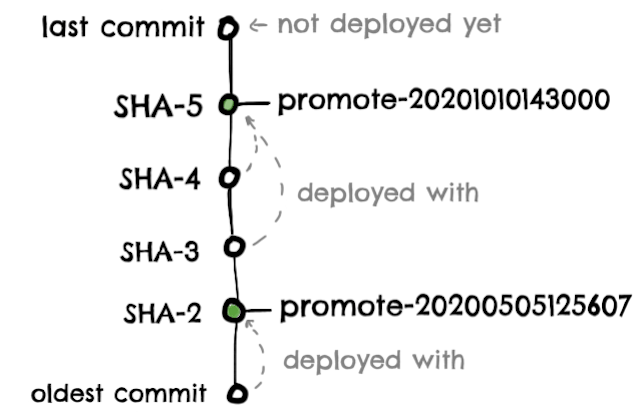
We need to calculate the amount of time it takes a commit to get into production, so we just need to know on which deployment a commit was deployed in, when a commit was committed, and when a deployment was deployed.
Commit deployment
“Just” a matter at looking at the closest promote- tag that it is in the future:

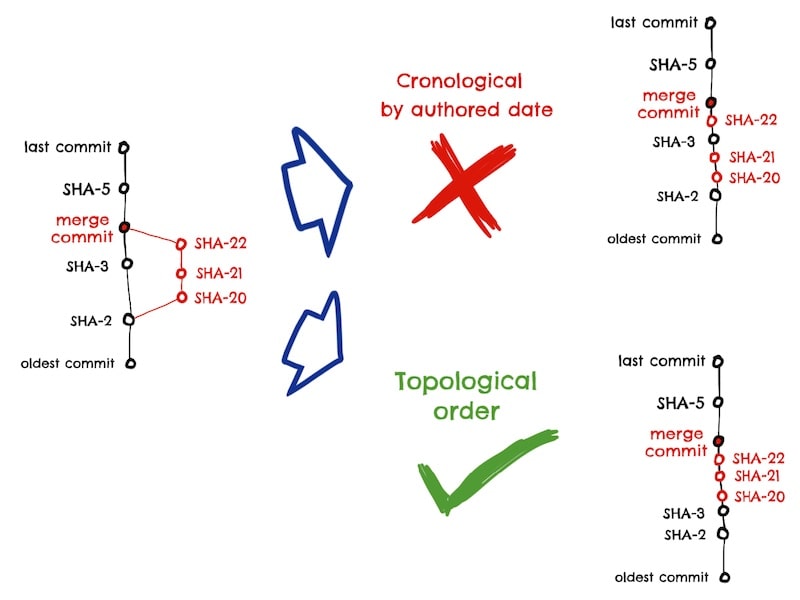
The only thing to be careful with is that the commits must be sorted in topological order, not chronological order:

The Git command git log --graph --pretty=oneline --abbrev-commit draws the commits in topological order.
Commit timestamp
Easy peasy lemon squeezy: Git contains the commit’s authored timestamp … except:
- When your team has the
badhabit of squash merging their pull requests, then we just have the merge commit timestamp. - We should ignore the merge commits, as those commits have no code review time, so it is not “fair” to count them as they will skew the results towards a better (lower) lead time.
GitHub keeps a link between a commit and the PR in the Commit’s associatedPullRequests field (for any kind of PR), and from the PR object we can find the original commits.
We could replace the merge commit with all the commits done in the PR, plus we should also ignore any merge commits from regular PR, but instead we decided that for all kinds of branches we will just take into account the authored date of the first commit and ignore all other commits.
This means that if you have been working for 10 days in a branch committing once a day, then your median delivery lead time will be 10 days, instead of 5 days if we were counting all the commits. This is more in accordance with the practices of small batches and trunk-based development encouraged in the DORA report.
Continuing the previous example:

So we keep the merge commit for the topological order, but we will use the first commit’s authored date when calculating the delivery lead time.
Deployment timestamp
The actual easy peasy lemon squeezy: we have the timestamp in the tag (careful to not use the commit timestamp the tag points to), in the name of the tag itself and in the CI build.
We opted for the CI build finish time as one of our application’s deployment pipeline took a significant amount of time to run, and the speed of the pipeline impacts the MTTR, so including the CI pipeline time is important.
3. Change fail rate
First instinct to implement the change fail rate is to have a way, maybe a UI, for developers to mark a deployment as failed.
But adding extra bureaucracy and another place to click around when trying to restore service, can only end up with people forgetting and managers complaining about developers not being “disciplined” enough to follow the process.
Instead, we assumed that a failed deployment will be followed by a deployment to fix whatever the issue was, so the deployment script will ask:
Does this deployment contain a hotfix for a previous deployment? [Y/n]
This reduces the friction to record a failure, as the developer knows why the new deployment is happening and is already running the deployment script, plus is just a Yes/No question.
The answer be stored as part of the promote- annotated tag, which we will be able to read from Git.
What is a failure?
A failure is any deployment that result in degraded service (for example, lead to service impairment or service outage) and subsequently require remediation (for example, require a hotfix, rollback, fix forward, patch).
As this definition didn’t seem clear enough for the team, we defined a failure as an issue that both:
- Some user has noticed or suffered it.
- You think (or say) “Oh, shit” when you learn about it.

Much more clear :).
4. Mean time to restore (MTTR) service
In theory, we were recording any incident in Atlassian’s StatusPage, from we can easily extract the timing information needed.
In practice, we opted for complaining about developers not being “disciplined” enough to follow the process of filling up StatusPage.
A possible automated way to calculate the MTTR is to look at the deployment history and use the time from a fix deployment to the previous failed deployment. This will still miss some outages, but it will require no additional bureaucracy.
Blue/Green applications
For applications with blue/green deployments, the release process requires one additional flip step:
- Flips in Test happen automatically after a successful automated smoke test run.
- Promotion happens from Live Test to Dark Production.
- Flips in Production are triggered manually after some QA the dark production cluster.
Deployment frequency
For blue/green applications, you have to decide what a deployment is. From the Accelerate’s site:
By “deployment” we mean a software deployment to production or to an app store. A release (the changes that get deployed) will typically consist of multiple version control commits.
I personally prefer this deployment and release definitions.
But should deploying to the production dark cluster count towards the deployment frequency?
We argued that no: if a change is not receiving production traffic, it cannot (or it is very unlikely to) cause a failure, hence it would not count towards the change fail rate, hence it should not count towards the deployment frequency.
So for blue/green applications, we want to look at the flips between dark/live.
Similar to the promotion script, the flip script just tags a commit with flip-$datetime which will trigger a CI build that will do the flip.
Delivery lead time
Same as regular applications, except that you want to compare commit timestamps against the flips.
Change fail rate
As the information will be more fresh in the developer’s mind at the time of promotion, we decided to keep the failure question in the promote script.
Then, to know if a flip should be counted towards the failure rate, we will aggregate all the promotions for the flip, and mark the flip as failure if any of the promotions was marked as failure.
Mean time to restore (MTTR) service
Same as regular applications :(.
There are still some scenarios to think about: feature flags, dark launches and canary releases.
But for us, this was a good enough starting point.
You can find all the (Clojure) code for the service that collected these metrics at GitHub.