Book notes: Project to Product
Book notes on Mik Kersten "Project to Product"
These are my notes on Mik Kersten’s Project to Product.
The book explains the Flow Framework, which tries to address the disconnect between Enterprise IT and Business.
The premise is that Enterprise Architecture is not aligned to product value streams, and that Enterprise IT in order to scale requires specialized tools which cause the value streams to be fragmented.
The Flow Framework basically provides two things:
- The Flow and Business metrics that you want to track per product value stream.
- A way of mapping the IT work (stored in the IT tooling) to the product value streams.
You can watch Mik Kersten presenting the Flow Framework.
Key Insights
- We are at the turning point of the Age of Software (the current technical revolution).
- SW is the new means of production.
- The main problem is that orgs are using management frameworks and infrastructure models from past revolutions.
- The common approach to enterprise architecture is wrong, as it focus on the needs of technologists and not the flow of business value.
- Product vs Projects (Full list):
| Project | Product | |
|---|---|---|
| Success | On time, on budget. | Business Outcomes. |
| Teams | Resources allocated to projects. | Allocate work to teams. |
- Flow Framework:
- Align IT investment with value streams.
- Scales the Three Ways of DevOps (flow, feedback and continuous learning) to the entire business.
- Measurable business result.
- At top level, it provides two things:
- Value stream metrics to track each value stream, so you can correlate production metrics to business outcomes.
- Value Stream Network: Infrastructure to measure the results delivered by each product.
- Flow items in SW development:
- Features: New business value.
- Defects: Quality.
- Risks: Compliance and security.
- Technical Debts.
- Flow Metrics:
- Result oriented metrics, like revenue and cost, not proxy metrics for value creation like deploys per day.
- Agile and DevOps metrics lie a layer down below the Flow FW.
- Flow Distribution:
- Distribution of the four flow items is the critical metrics for aligning value streams to business strategy.
- Flow Distribution trade-off are understandable to business stakeholders that have no IT background.
- Flow Velocity:
- Accelerate metrics not as important if your bottleneck is not deployment automation.
- Flow Time:
- Starts when a flow item is accepted into the value stream until is delivered.
- 4 flow item states: new, waiting, active, done
- Flow time: active –> done.
- Flow Load: WIP.
- Flow Efficiency.
- Result oriented metrics, like revenue and cost, not proxy metrics for value creation like deploys per day.
- Business needs for flow velocity and flow time should drive the architecture of a value stream.
- Business Outcome metrics: Value, Cost, Quality and Employee Happiness.
- How to measure them is org specific.
- Enterprise IT has tons of specialized tools and they are disconnected, which causes the flow of a value stream to be fragmented.
- Specialization is required to scale, but creates information silos.
- SW is fundamentally different from physical production, so attempting to emulate a model that worked for physical production is the wrong approach.
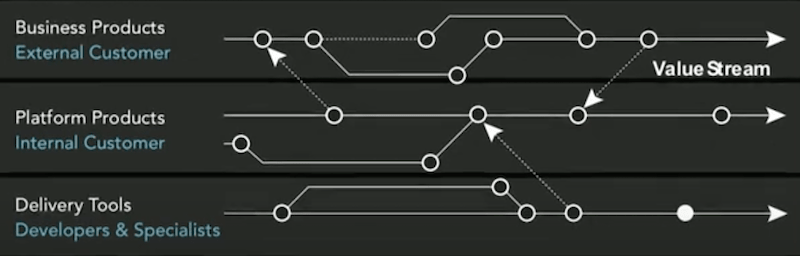
- Network-based model is more representative for SW dev than a linear manufacturing flow.
- In network management, bottlenecks are constraints that you simply reroute around.
- Flow does not need to stop as it does in a linear process.
- See Flow Framework poster from the Flow Framework website.
- An important detail about the Value Stream Network that is not in the diagram or book but that is in Mik Kersten talks:
- My very simplified version:
- An important detail about the Value Stream Network that is not in the diagram or book but that is in Mik Kersten talks:
TOC
- Introduction: The Turning Point
- Part I: The Flow Framework
- Part II: Value Stream Metrics
- Part III: Value Stream Networks
Introduction: The Turning Point
- Each Tech revolution has 3 periods:
- Installation period: loads of start-ups that disrupt entire industries from previous age.
- Turning point: Business masters the new means of production or it will become obsolete.
- Deployment period: product capital from new industry giants start taking over.
- We are at the turning point of the Age of Software.
- SW is the new means of production.
- The main problem is that orgs are using management frameworks and infrastructure models from past revolutions.
- Flow Framework:
- align IT investment with value streams.
- Scales the Three Ways of DevOps (flow, feedback and continuous learning) to the entire business.
- Measurable business result.
Part I: The Flow Framework
Chapter 1 - The Age of Software
- BMW Group forecast that all innovation at the company will be powered by SW, and that half of their staff will be SW devs.
- Types of disruption (Geoffrey Moore, Zone to Win):
- Infrastructure model: how customer access a given product.
- Operating model: change the relationship of the customer with the business.
- Business model: more fundamental.
- The type of disruption determines the shape of your IT investment and value streams.
- Moore: established enterprises are not capable of disrupting themselves and, as such, must establish an innovation engine that will allow them to catch the next wave of disruption emerging in another market category.
- Summary of Carlota Perez “Technological Revolutions and Financial Capital”:
- Technology improvements are incremental, yielding less than 10% of productivity gains.
- The common approach to enterprise architecture is wrong, as it focus on the needs of technologists and not the flow of business value.
- Mik’s three epiphanies:
- Productivity declines and waste increases as SW scales due to disconnects between architecture and the value stream.
- Value stream disconnects are caused by the misapplication of the project management model.
- SW value streams are not linear manufacturing processes but complex collaboration networks that need to be aligned to products.
Chapter 2 - From Project to Product
- Nokia IT transformation failure:
- Measure activities not outcomes.
- Disconnect of IT and Business.
- Local optimizations, not end-to-end value stream.
- Large Bank failure:
- IT as a cost center, under the CFO.
- Reduced productivity.
- Disconnect of IT and Business.
- Sticking to the plan.
- Project mentality.
- IT as a cost center, under the CFO.
- Boeing 777: all SW leads in the test flight.
- Profitability and product/market fit should drive the architecture of the value stream.
- Moore’s 4 horizons:
- Productivity zone: bottom line.
- Performance zone: top line, main revenue.
- Incubation zone: new products and services.
- Transformation zone:
- Disruption offence/defense.
- Products/Services from the incubation zone.
- Success metrics on those zones are different.
- Project mentality: people are interchangeable resources.
- Product vs Project:
| Project | Product | |
|---|---|---|
| Budgeting | Pre-funded. Encourages hoarding and large batches. No incentive for feedback loop. |
Based on business results. Based on demand. Feedback loop encouraged. |
| Time Frames | There is an end date. Maintenance not highly important. |
No predefined end of life. Maintenance is core. |
| Success | On time, on budget. | Business Outcomes. |
| Risk | Optimized for obvious and complicated (cynefin) context. Identify and offset all risk at inception. |
Chaotic and complex. Incremental. More managerial overhead as requires frequent reviews and checkpoints. |
| Teams | Resources allocated to projects. | Allocate work to teams. |
| Prioritization | Changes in plan are expensive, hence minimized. | Continuous reevaluation based on feedback loops. |
| Visibility | IT is a black box. | Transparency through direct mapping to business outcomes. |
Chapter 3 - Introducing the Flow Framework
- Flow Framework assumes that the best suited practices for your business are already underway.
- The role of the Flow FW is to ensure that the business level framework and transformation initiatives are connected to the technical ones.
- Questions fundamental to production:
- Who is the customer?
- What value is the customer pulling?
- What are the value streams?
- Where is the bottleneck?
- Flow FW will allow you to:
- See end-to-end flow of business value in real time.
- Instantly spot bottlenecks and use them to prioritize investment.
- Test hypothesis based on real time date from every value stream.
- Rearchitect your organization around maximizing flow.
- Result oriented metrics, like revenue and cost, not proxy metrics for value creation like deploys per day.
- Requires Lean thinking (from Lean Thinking by James P. Womack and Daniel T. Jones):
- Precisely specify value by specific product.
- Identify the value stream for each product.
- Make value flow without interruptions.
- Let the customer pull value from producer.
- Pursue perfection.
- Value stream: the end-to-end set of activities performed to deliver value to a customer through a product or service.
- Agile and DevOps metrics lie a layer down below the Flow FW.
- At top level, Flow FW provides two things:
- Value stream metrics to track each value stream, so you can correlate production metrics to business outcomes.
- Value Stream Network:
- To measure the results delivered by each product.
- Flow items in SW development (What value the customer pulls?):
| Flow Item | Delivers | Example artifact |
|---|---|---|
| Features | New business value | Epic, user story |
| Defects | Quality | Bug, incident, outage |
| Risks | Security, Compliance | Vulnerability, regulatory requirement |
| Debts | Removal of impediments to future delivery | API addition, refactoring, automation |
Part II: Value Stream Metrics
- Value stream metrics: measure both the flow metrics and business results for each product’s value stream.
Chapter 4 - Capturing Flow Metrics
- Decide which lead time is suitable fo reach value stream.
- Flow Metrics:
- Flow Distribution:
- Distribution of the four flow items is the critical metrics for aligning value streams to business strategy.
- The proportion of each flow item within a value stream, adjusted depending on the needs of each stream to maximize business value.
- Example: New products should have a high % of features, while legacy should have a high % of risk and defects.
- Should be tuned depending on Moore’s Zone Management.
- Has far-reaching implications for how a product’s value stream is structured and managed.
- Flow Distribution trade-off are understandable to business stakeholders that have no IT background.
- Flow items should be of similar size to be able to compare/balance.
- Is a zero-sum game.
- Flow Velocity:
- Number of flow items delivered per period.
- The value estimation and prioritization of the items is done using Agile FW and product management processes.
- Accelerate metrics not as important if your bottleneck is not deployment automation.
- Flow FW ignores item sizes (Law of big numbers):
- As such, is suited to track productivity within a value stream, not across value streams.
- Flow Time:
- Starts when a flow item is accepted into the value stream until is delivered.
- Wall clock time.
- 4 flow item states: new, waiting, active, done
- Lead time: new –> done.
- Flow time: active –> done.
- So flow time does not include waiting time in the backlog.
- Flow Load:
- Leading indicator of any problems that will affect flow velocity and flow time.
- WIP.
- Total number of flow items being worked on (active or waiting state) within a particular value stream.
- Flow Efficiency:
- Total active time / Flow Time.
- Flow time == total active time + total waiting time.
- Flow Distribution:
- Business needs for flow velocity and flow time should drive the architecture of a value stream.
Chapter 5 - Connecting to Business Results
- Feedback at the right level of granularity is essential to support decision-making.
- Business Outcome metrics:
- How to measure them is org specific.
- Value:
- Most important metric.
- Revenue.
- If not monetized directly, then use indirect value of the other value streams it supports.
- Value Stream Network will make this explicit and visible.
- Cost:
- Only delivery cost + proportion of shared costs.
- Quality:
- Escaped defects, incidents, NPS, renewal rate.
- Happiness:
- eNPS.
- “On a scale of zero to ten, how likely is it you would recommend this company as a place to work?”
- “How likely would you be to recommend this company’s products or services to a friend or colleague?”
Chapter 6 - Tracking Disruption
- Examples of Nokia, Equifax, Automotive SW and Microsoft.
Part III: Value Stream Networks
Chapter 7 - The Ground Truth of Enterprise Tool Networks
- Longer explanation of first two epiphanies.
Chapter 8 - Specialized Tools and the Value Stream
- As complexity of work scales, so it is the pressure on the tools to specialize.
- For each different type of work , there should be at most one tool in the value stream providing the support for that function.
- Fundamental complexity instances:
- Stakeholder specialization.
- Scale specialization.
- Platform specialization.
- Moore’s Zone specialization.
- Legacy.
- Supplier diversity.
- Disconnect between tools used by different types of work cause work to be lost, delays and errors.
- Enterprise IT has tons of specialized tools, and they are disconnected, which causes the flow of a value stream to be fragmented.
- Expect more specialized tools in the future.
- Having all those tools connected creates a strategy advantage.
- Specialization is required to scale, but creates information silos.
Chapter 9 - Value Stream Management
- SW is fundamentally different from physical production, so attempting to emulate a model that worked for physical production is the wrong approach.
- To transition a company from project to product, start with the tool network, then the artifact and last the Value Stream Network.
- In network management, bottlenecks are constraints that you simply reroute around.
- Flow does not need to stop as it does in a linear process.
- Network-based model is more representative for SW dev than a linear manufacturing flow.
- Key differences:
| Manufacturing | SW dev | |
|---|---|---|
| Variability | Fixed well-defined set of variations. Aim to minimize it |
Open ended. Embrace it. |
| Repeatability | Maximize throughput of same widget. | Maximize iteration and feedback loop to continuously reshape the widget |
| Design Frequency. | Up-front in project-like process. Changes infrequent and require changes in the production line. |
Design happens inside the production system. For each flow item |
| Design Frequency. | Removed. Aim for full automation. |
Focus on enabling creativity. Automation support it. |
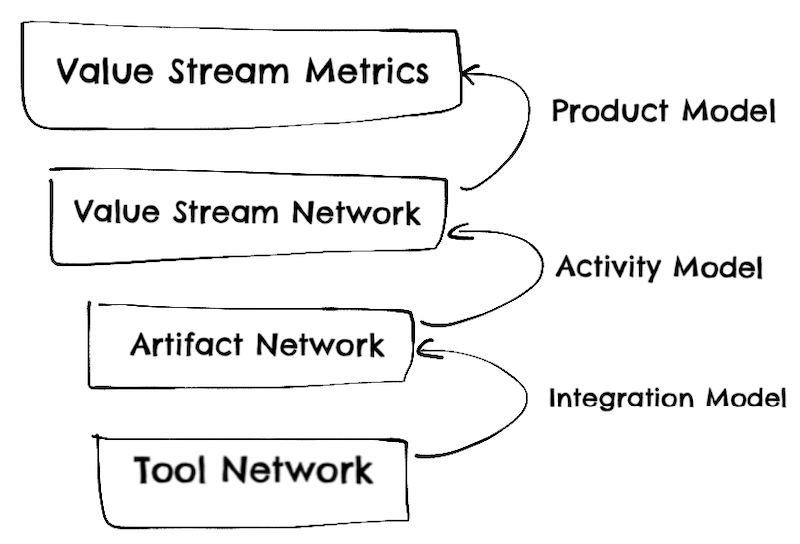
- Flow FW has identified 3 layers of abstraction:
- End goal is enabling product-oriented Value Stream Management.
- The layers connect the implementation details of the tool layer to business value-oriented views.
- Tool network:
- Connectivity index: % tools integrated.
- Measures confidence on flow metrics.
- Connectivity index: % tools integrated.
- Integration Model:
- Map tool specific items to one of the four flow items.
- Allows to track one flow item across all tools, which allows measuring flow metrics.
- Artifact Network:
- If a company has 100 value streams, a single integration model will be instantiated 100 times into 100 different artifact networks.
- Traceability index:
- The measure of artifact connection breath and depth relative to artifact type.
- Reflects business visibility and degree of automation.
- Activity model:
- Identifies each of the specific activities performed in the value stream and maps those to the concrete workflow states defined by the Integration Model.
- Also, maps these activities to the flow states, enabling a consistent way of measuring flow across all artifacts.
- Value Stream Network:
- Shows how much business value each value stream is delivering and where its bottlenecks and opportunities may lie.
- Product Model:
- Map artifacts stored in the tool network to the product-oriented value streams.
- Alignment index: the % of artifacts containers connected to a product value stream.