Prometheus in a Clojure stack: Duct, Jetty, Compojure/Reitit and Hugsql
How to integrate a Clojure HTTP service with Prometheus
We are going to explain how to integrate Prometheus, one of the most popular open source monitoring systems, into a Clojure stack.
We will use my current Clojure stack of choice:
- Duct for dependency injection.
- Jetty as the HTTP server.
- Reitit for HTTP server routing. We will also see Compojure due to its popularity.
- HikariCP for DB connection pooling.
- HugSQL for SQL access.
We will use the iapetos Prometheus client library.
All the code is available at https://github.com/dlebrero/clojure-prometheus-example.
The basics
For starters, we will collect the monitoring information for the JVM plus some basic Ring stats.
The dependencies:
[clj-commons/iapetos "0.1.11"]
[io.prometheus/simpleclient_hotspot "0.9.0"]
[duct/core "0.8.0"]
[ring/ring-jetty-adapter "1.8.2"]
[org.eclipse.jetty/jetty-server "9.4.31.v20200723"] ;; See Gotcha section at bottom
[org.eclipse.jetty/jetty-servlet "9.4.31.v20200723"]
The Duct configuration required is:
:prometheus-example.handler.monitoring-basic/collector {} ;; (1)
:prometheus-example.handler.monitoring-basic/middleware ;; (2)
{:collector #ig/ref :prometheus-example.handler.monitoring-basic/collector}

:duct.handler/root
{:middleware ^:distinct
           [#ig/ref :prometheus-example.handler.monitoring-basic/middleware]}
The Prometheus Client requires you to register all the metrics that you are going to collect beforehand, which is what we are doing at (1) in :prometheus-example.handler.monitoring-basic/collector:
(defmethod ig/init-key :prometheus-example.handler.monitoring-basic/collector [_ config] ;; This is (1)
  (->
    (iapetos.core/collector-registry)
    (iapetos.collector.jvm/initialize)
    (iapetos.collector.ring/initialize)))
At (2), we add the Ring middleware that:
- Collects the actual timing and errors for the HTTP requests.
- Exposes a “/metrics” endpoint for Prometheus to collect the data.
(defmethod ig/init-key :prometheus-example.handler.monitoring-basic/middleware [_ {:keys [collector]}] ;; This is (2)
  #(-> %
     (iapetos.collector.ring/wrap-metrics collector {:path "/metrics"})))
After this, we have in our /metrics endpoint the following stats:
- JVM threads and their state.
- JVM GC and memory stats.
- CPU usage.
- HTTP histograms per path and return code.
Jetty HTTP server
As we are going to be using Jetty, we need to monitor its health. The monitoring provided by the Prometheus-Jetty integration is:
- Basic HTTP metrics from the point of view of Jetty itself. Note that the Ring metrics are captured several layers down the stack, while the Jetty metrics will provide us with a more complete view if there is something wrong going on between the Jetty code and the Ring metrics code.
- Health metrics about the Jetty thread pool that is serving the HTTP requests.
The dependencies to add are:
[io.prometheus/simpleclient_jetty "0.9.0"]
[io.prometheus/simpleclient_jetty_jdk8 "0.9.0"]
And the Duct configuration:
:prometheus-example.handler.monitoring-basic/jetty-configurator ;; (3)
{:collector #ig/ref :prometheus-example.handler.monitoring-basic/collector}

:duct.server.http/jetty ;; (4)
{:configurator #ig/ref :prometheus-example.handler.monitoring-basic/jetty-configurator}
At (3), the :prometheus-example.handler.monitoring-basic/jetty-configurator will add the required Jetty configuration plus register the metrics.
Then at (4) we have to configure the default Jetty server provided by Duct Web module to use this configurator.
REST routes
The basic Ring configuration that we have seen so far has the problem that if you use path parameters in your routes then you are going to end up with one metric for every and each different value of that path parameter.
For example, if you have the following Compojure route:
(GET "/some-path/:path-param/before" [path-param]
  {:body {:example "data" :param path-param}})
Two HTTP call to /user/some-path/dan/before and /user/some-path/lebrero/before, then your metrics are going to have:
http_requests_total{method="GET",status="200",statusClass="2XX",path="/some-path/dan/before",} 1.0
http_requests_total{method="GET",status="200",statusClass="2XX",path="/some-path/lebrero/before",} 1.0
What you really want is just one metric like:
http_requests_total{method="GET",status="200",statusClass="2XX",path="/some-path/:path-param/before",} 1.0
Compojure
To know which route was matched we need to use Compojure’s wrap-routes, which allows to inject a middleware just after the matching route has been found. The matched route will be available in the request :compojure/route key.
Now is a matter of bubbling up that information to the metrics middleware:
(defmethod ig/init-key ::middleware [_ {:keys [collector]}]
  #(-> %
     (ring/wrap-metrics collector {:path "/metrics"
                                   :label-fn (fn [req resp]
                                               (if resp
                                                 {:path (str (::context resp) (second (::route resp)))}
                                                 {:path (:uri req)}))})
     (compojure/wrap-routes (fn [handler]
                              (fn [req]
                                (assoc
                                  (handler req)
                                  ::route (:compojure/route req)
                                  ::context (:context req)))))))
- In the
wrap-routeswe capture the route and context. - In the
wrap-metricswe use that information to build the proper metrics path.
There are two important quirks with this code:
- Exceptions do not get the proper path. To fix, you would need to:
- Catch any exception in
wrap-routesand throw some slingshot or custom exception. - Write your own
ring/wrap-metricsto handle those exceptions. - Note that if the error happens before the route matching, you cannot really do anything about it.
- Catch any exception in
- If you have nested Compojure contexts like this example, then you end up with basically the same path parameters issue as in the basic configuration, but for context. To fix it, you need:
You also have the option to do the metrics instrumentation inside the wrap-routes code as in here but then you are not measuring any middleware or code in a Compojure context, plus you will still need to deal with both quirks above.
Reitit
All the quirks with Compojure show us that, at least for this particular problem, a data-driven library ends up allowing a simpler and more elegant solution.
Apart from adding the Reitit dependency, you will need the following Duct configuration:
  :prometheus-example.handler.example-reitit/router ;; (5)
  {:collector #ig/ref :prometheus-example.handler.monitoring-basic/collector
   :db #ig/ref :duct.database/sql}

  :duct.router/cascading
  [#ig/ref [:prometheus-example.handler.example-reitit/router]]
So we are integrating Reitit as a simple middleware, which has a very simple implementation:
(defmethod ig/init-key :prometheus-example.handler.example-reitit/router [_ {:keys [collector db]}] ;; this is (5)
  (let [router (reitit.ring/router (routes db)
                 {:data {:middleware [(fn [handler] ;; (6)
                                        (iapetos.collector.ring/wrap-instrumentation handler collector
                                          {:path-fn (fn [req] (:template (reitit.ring/get-match req)))}))]}})] ;; (7)
    (reitit.ring/ring-handler router nil
      {:middleware [(fn [handler]
                      (iapetos.collector.ring/wrap-metrics-expose handler collector {:path "/metrics"}))]})))
So to our Reitit routes to we are injecting at (6) the wrap-instrumentation middleware, that at (7) simply extracts the matched path from the request.
Neither of the issues mention with Compojure exist, and the code ends up being simpler.
Database
For the database we need to instrument two things: the database connection pool and the execution of the SQL queries.
HikariCP
Duct by default comes with dependencies for HikariCP that is an excellent database connection pool.
As HikariCP comes with support for Prometheus, we just need to initialize it properly:
  :prometheus-example.handler.monitoring-database/hikaricp
  {:hikari-cp #ig/ref :duct.database.sql/hikaricp
   :metrics-collector #ig/ref :prometheus-example.handler.monitoring-basic/collector}
And the initalization code:
(defmethod ig/init-key :prometheus-example.handler.monitoring-database/hikaricp
   [_ {:keys [hikari-cp metrics-collector] :as options}]
   (-> hikari-cp
      :spec
      :datasource
      (.setMetricsTrackerFactory
         (com.zaxxer.hikari.metrics.prometheus.PrometheusMetricsTrackerFactory.
            (iapetos.registry/raw metrics-collector))))
   hikari-cp)
See the HikariCP documentation for the metrics collected.
HugSQL
To instrument HugSQL, we need to create a HugSQL adapter that will decorate the underlying HugSQL adapter with the required metrics instrumentation:
(defmacro metrics
  [metrics-collector options & body]
  `(if ~metrics-collector
     (let [labels# {:query (:fn-name ~options), :result "success"}
           failure-labels# {:query (:fn-name ~options), :result "failure"}]
       (iapetos.core/with-success-counter (~metrics-collector :sql/run-total labels#)
         (iapetos.core/with-failure-counter (~metrics-collector :sql/run-total failure-labels#)
           (iapetos.collector.exceptions/with-exceptions (~metrics-collector :sql/exceptions-total labels#)
             (iapetos.core/with-duration (~metrics-collector :sql/run-duration labels#)
               ~@body)))))
     (do ~@body)))

(deftype MetricsAdapter [metrics-collector jdbc-adapter]

  hugsql.adapter/HugsqlAdapter
  (execute [_ db sqlvec options]
    (metrics metrics-collector options
      (hugsql.adapter/execute jdbc-adapter db sqlvec options)))

  (query [_ db sqlvec options]
    (metrics metrics-collector options
      (hugsql.adapter/query jdbc-adapter db sqlvec options)))

...
  )
And then just set the adapter as the default HugSQL adapter:
(hugsql.core/set-adapter!
   (MetricsAdapter.
      (iapetos.core/register metrics-collector ;; See Gotcha section at bottom
         (iapetos.core/histogram
            :sql/run-duration
            {:description "SQL query duration"
             :labels [:query]})
         (iapetos.core/counter
            :sql/run-total
            {:description "the total number of finished runs of the observed sql query."
             :labels [:query :result]})
         (iapetos.collector.exceptions/exception-counter
            :sql/exceptions-total
            {:description "the total number and type of exceptions for the observed sql query."
             :labels [:query]}))
      (hugsql-adapter-case.adapters/kebab-adapter)))
In the example project we do this as part of the :prometheus-example.handler.monitoring-database/hikaricp init key.
The SQL metrics will be collected per HugSQL function name as per:
sql_run_duration_count{query="upsert-user!",} 4.0
sql_run_duration_count{query="get-user-by-email",} 2.0
All together
Putting it all together, you will have an endpoint to expose all the Prometheus metrics to know the health of your service:
- JVM threads and their state.
- JVM GC and memory stats.
- CPU usage.
- Performance and error metrics per HTTP route.
- Basic HTTP metrics from the point of view of Jetty itself.
- Health metrics about the Jetty thread pool.
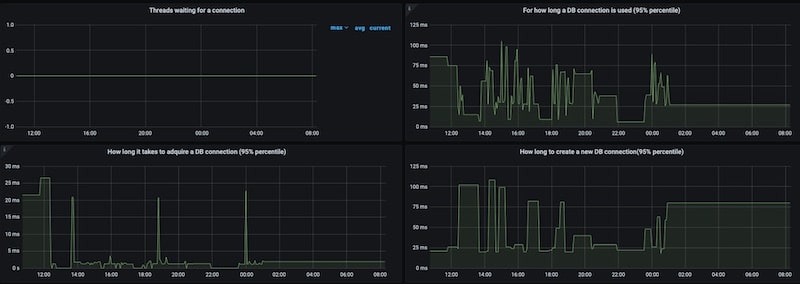
- Health and some performance metrics for the HickariCP connection pool.
- Performance and error metrics per SQL call.
Collecting is just the first step on the road. Now you need to visualize the data and create alerts to know when something requires your attention, which require their own blog posts.
Gotchas
Here is a list of bumps on the road while building the example application.
ClassNotFoundException (org.eclipse.jetty.util.ssl.SslContextFactory$Server)
Symptom: Application not starting because:
Syntax error (ClassNotFoundException) compiling at (ring/adapter/jetty.clj:1:1).
org.eclipse.jetty.util.ssl.SslContextFactory$Server
Cause: Latest Version of [io.prometheus/simpleclient_jetty_jdk8 "0.9.0"] brings [org.eclipse.jetty/jetty-server "9.4.4.v20170414"] which does not come with that class and that ring-jetty-adapter depends on.
Fix: explicitly depend on [org.eclipse.jetty/jetty-server "9.4.31.v20200723"] and [org.eclipse.jetty/jetty-servlet "9.4.31.v20200723"], or exclude those dependencies from simpleclient_jetty_jdk8
ClassCastException when starting Duct
Symptom: Application not starting because:
Execution error (ClassCastException) at duct.core/eval4586$fn (core.clj:258).
class clojure.lang.PersistentList cannot be cast to class clojure.lang.Associative (clojure.lang.PersistentList and clojure.lang.Associative are in unnamed module of loader 'app')
Cause: I had deleted the dev/resources/dev.edn as it was empty. This caused the :duct.profile/dev #duct/include "dev" in the resources/prometheus_example/config.edn file to include the dev/src/dev.clj file in the Duct config.
Fix: Add empty dev/resources/dev.edn or delete #duc/include "dev" from the resources/prometheus_example/config.edn
No implementation of method: :increment* of protocol: #’iapetos.operations/IncrementableCollector found for class: nil
Symptom: Any call to iapetos.core/inc or similar functions fail with:
No implementation of method: :increment* of protocol: #'iapetos.operations/IncrementableCollector found for class: nil
Cause: iapetos wraps the mutable Prometheus CollectorRegistry with its own immutable abstraction, which will create “phantom” metrics: a metric that exists in the Prometheus CollectorRegistry but not in the iapetos one.
This confused me as the /metrics endpoint uses the underlying Prometheus registry, so “phantom” metrics will be shown.
Fix: Have one place to register all the metrics in the iapetos registry, or be aware of the fact when registering the metrics.